Managing sourcing financials requires looking far beyond the initial unit price to avoid the thin margins that often sink import businesses. If you base your retail pricing on a factory FOB quote, you ignore the secondary costs that accumulate during transit and customs clearance. This oversight leads to pricing inaccuracies that can drain capital and stall your company’s growth.
This walkthrough details the math behind a total landed cost formula, accounting for sea freight, import duties, and bond fees. We examine the impact of local drayage and fuel surcharges while explaining how wire transfer fees and currency exchange rates affect your final balance. You will find a roadmap for building a custom calculation tool in Excel to standardize your procurement process and protect your profitability.
Is the Unit Price a Lie? The Total Landed Cost Formula
Relying on invoice prices for high-density materials like natural stacked stone creates a financial blind spot that typically erodes 20% to 40% of projected B2B margins.
Total landed cost represents the absolute financial output required to move stone products from the quarry to your final warehouse. We define this as the aggregate of the unit price plus freight, duties, taxes, insurance, and all associated handling fees. Current 2026 supply chain standards demand tracking every touchpoint to ensure accurate financial reporting. Buyers who focus exclusively on the invoice price fail to account for the secondary costs that determine whether a project is actually profitable.
Core Variables of the Landed Cost Equation
The landed cost formula serves as the only reliable metric for determining the true value of a shipment. For stone importers, this includes the material cost, international ocean freight, customs duties, and the “last mile” drayage from the port. Accurate calculations allow wholesalers to avoid the trap of “ghost profits,” where a seemingly cheap order results in a net loss after accounting for port exams and broker fees.
- Proportional Freight: Heavy stone materials require allocating shipping costs by weight rather than just volume to reflect real-world logistics pricing.
- Duty & Tariff Impact: Base material costs can fluctuate by over 50% depending on the country of origin and current trade classifications.
- Handling Fees: Warehouse operations and weight verification fees are fixed costs that significantly impact small-to-medium-sized trial orders.
Why Factory Quotes Underestimate Procurement Reality
Standard FOB or EXW prices do not account for the logistical complexities of moving heavy ledger panels across borders. A low unit price for stacked stone often hides systemic inefficiencies in packaging or load density. We observed that neglecting export documentation and port charges leads to unexpected budget overruns that the factory quote never mentions.
The cheapest factory price frequently results in a higher final cost due to poor logistics support. If a supplier fails to optimize container loading—such as our standard 25-30 pallets per 20GP—the per-square-foot shipping cost spikes. Professional procurement requires looking past the per-unit quote to see how the supplier’s crate engineering and port proximity affect the final landed figure.
Strategic Importance of Margin Transparency in 2026
Transparency in landed costs allows distributors to set retail prices that are both competitive and sustainable. Data-driven procurement teams use the landed cost formula to compare suppliers from different geographic regions, identifying which source provides the best value after all taxes and surcharges are applied. This level of detail helps contractors and wholesalers maintain stable margins despite the inherent volatility of sea freight rates.
Automation tools now simplify these complex calculations, reducing the manual accounting errors that historically plagued the stone industry. By integrating real-time duty forecasting and currency fluctuations into the cost stack, businesses protect their cash flow. Understanding the full cost stack ensures that every square foot of natural stone sold contributes directly to the bottom line rather than being consumed by hidden fees.
Factoring in Sea Freight, Duties, and Bond Fees
True profit margins in 2026 stone procurement depend on the precision of landed cost modeling, where ocean freight efficiency and duty classification accuracy outweigh the initial ex-factory unit price.
Estimating Ocean Freight and Container Space Utilization
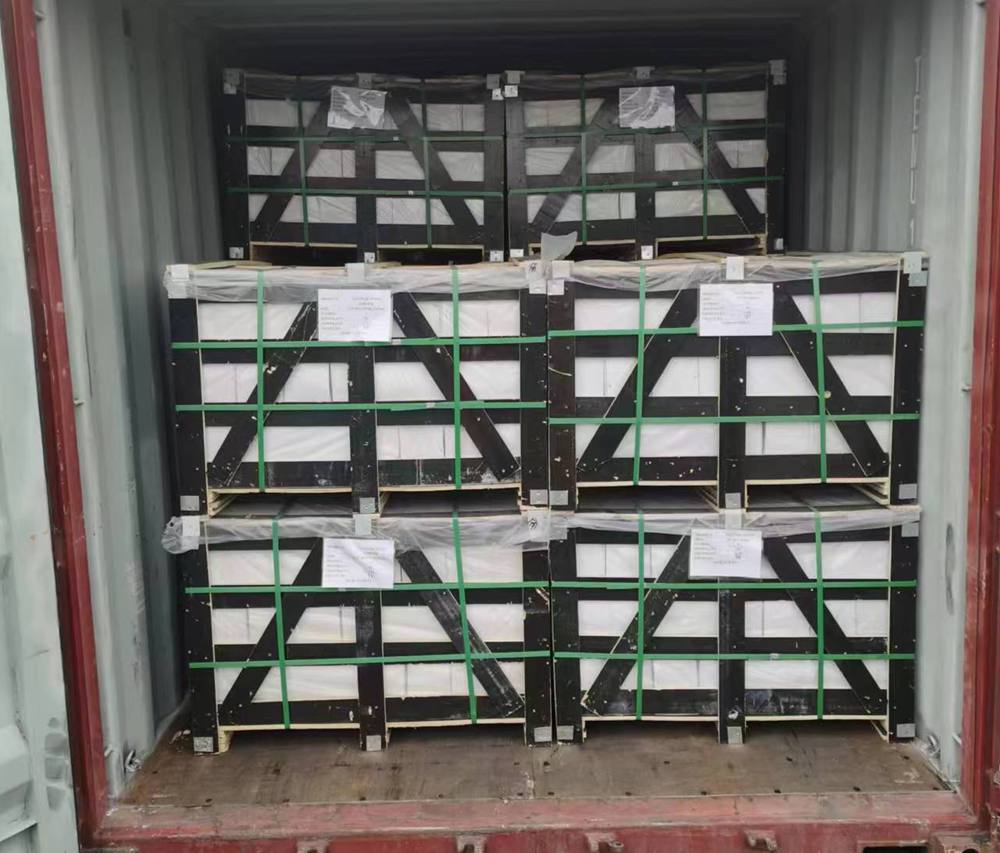
Shipping natural stone requires a rigorous understanding of weight-to-volume ratios. Our standard panels weigh between 8-13 lbs per square foot, which means a 20GP container reaches its weight capacity long before its physical volume is full. In the 2026 logistics environment, we optimize every shipment against the 17.5-ton U.S. port weight limit. Exceeding this threshold triggers heavy-weight permits or mandatory transloading, which adds thousands to the landed cost. We utilize strategic loading patterns and reinforced 5-ply export-grade cartons to maximize the square footage per crate while staying within safe road-weight tolerances.
- We calculate loads to prevent shifting during transit, ensuring the 95% hue uniformity of your batch arrives intact.
- Strategic use of 20GP containers allows for 25-30 pallets, providing coverage of up to 860 m² for standard panels.
- Freight modeling accounts for seasonal rate shifts, keeping factory-direct pricing stable for our distribution partners.
Navigating Import Duties and Tariff Classifications
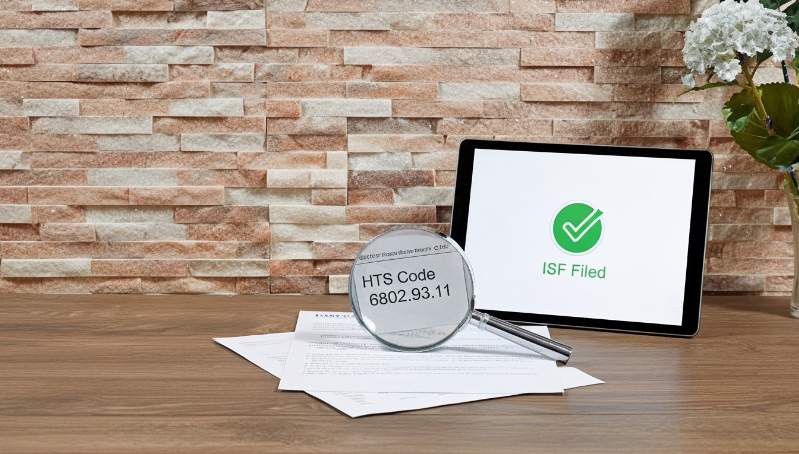
Accurate HTS (Harmonized Tariff Schedule) classification is the primary defense against unexpected port expenses. We apply specific 2026 codes—6803.00.90 for slate and 6802.93.11 for quartzite—to ensure clearance is handled correctly. Misclassifying marble as quartzite or failing to document the country of origin leads to penalties or the application of anti-dumping duties that can exceed 300% in certain regions. We maintain strict documentation standards to protect your margins from these volatility risks.
| Import Component | 2026 Standard Requirement | Landed Cost Impact |
|---|---|---|
| Continuous Customs Bond | 10% of annual duties (Min $50,000) | Fixed annual premium ($250-$750) |
| Quartzite HTS: 6802.93.11 | 5% – 25% (Varies by origin) | Direct addition to per-sq.ft cost |
| U.S. Port Weight Limit | 17.5 Tons (Standard Max) | Prevents heavy-weight surcharges |
| ISF Filing Accuracy | 100% compliance mandatory | Avoids $5,000 CBP penalties |
Meeting Customs Bond and Compliance Requirements
U.S. Customs and Border Protection (CBP) standards in 2026 mandate that importers maintain sufficient bond coverage to guarantee the payment of duties and taxes. Most B2B stone importers require a continuous bond, typically calculated at 10% of the total annualized duties paid. CBP now monitors these thresholds in real-time. If your import volume spikes mid-year, you may receive a “Demand for Increased Bond” notice. Failure to respond to these notices immediately can lead to port holds, where daily storage fees quickly erode the cost-efficiency of sourcing from a direct quarry.
Managing Importer Security Filing and Documentation
Administrative holds at the port are often the result of minor documentation errors. We integrate real-time duty forecasting with our supply chain platforms to ensure 100% ISF filing accuracy. This includes managing the specific documentation required for fumigated wooden crates or plywood crates to comply with international phytosanitary standards. Proactive monitoring of these filings prevents the administrative delays that lead to “Invisible” costs, such as demurrage and detention fees, ensuring the flow of stone from our quarry to your warehouse remains uninterrupted.
- We provide high-definition pre-shipment visual verification of every crate to confirm compliance before the balance payment.
- Automated document management ensures that ISF filings are submitted at least 24 hours before the vessel departs Xingang port.
- Compliance with fumigation standards for solid wood crates eliminates the risk of terminal rejection or mandatory re-exportation.
Premium Stacked Stone for Architectural Excellence

Don’t Forget the “Invisible” Local Drayage and Fuel Surcharges
Drayage and fuel surcharges in 2026 are no longer minor line items; for heavy natural stone, these “invisible” costs frequently rival the base ocean freight rate.
Impact of Fuel Price Volatility on Stone Logistics
Fuel price fluctuations directly influence the final invoice for transporting heavy natural stone panels from ports to warehouses. Because stacked stone is a high-density commodity, often reaching 8-12 lbs per square foot, carriers require specialized equipment that consumes more diesel. Surcharges act as a variable cost that requires constant monitoring to maintain accurate profit margins.
- Heavy loads, such as crated slate and quartzite, often incur higher fuel-related costs due to weight-based equipment requirements.
- Carriers adjust rates weekly based on market shifts, making quarterly budgeting difficult without a buffer.
- Linehaul rates might look stable, yet the fuel adjustment can swing the total drayage cost by 20% in a single month.
Transition to Indexed Fuel Surcharge Models
Most carriers now utilize the U.S. Energy Information Administration’s (EIA) diesel price index to calculate weekly adjustments. This shift toward indexed models provides transparency that was previously lacking in the drayage sector. Standardizing surcharges against public data prevents arbitrary price hikes by local trucking companies, allowing stone importers to verify every line item against a neutral benchmark.
| Surcharge Type | Calculation Basis | Impact on Stone Shipments |
|---|---|---|
| Fuel Surcharge | EIA Diesel Index % | Variable; highest on heavy 20GP loads. |
| Yard Pull (Pre-Pull) | Flat fee per container | Necessary to avoid high port demurrage. |
| Chassis Split | Flat fee per move | Occurs when chassis are not at the port. |
| Congestion Fee | Per container/Per day | Common in high-volume ports (LA/LB, Savannah). |
Managing Congestion and Yard Pull Fees
Operational delays at terminals often lead to “invisible” fees like congestion surcharges and pre-pull expenses. Congestion fees apply when port wait times exceed standard windows, a frequent issue for high-volume importers of stacked stone who utilize busy hubs like Houston or Long Beach. To mitigate these, savvy distributors use “yard pulls” or “pre-pulls,” moving a container to a carrier’s secure yard to avoid port demurrage. While this adds a specific line item to the invoice, it usually costs significantly less than the port’s daily storage penalties.
- Yard pulls ensure containers are ready for delivery as soon as warehouse space opens.
- Drop fees occur when a driver leaves a container for unloading and returns later, common for heavy stone shipments that take longer to unpack.
- Tracking these fees at the SKU level ensures that “Alaska Gray” or “Carbon Black” inventory maintains its projected margin.
Local Drayage Structures and Cost Transparency
Carriers employ diverse pricing models, including per-mile, percentage-of-linehaul, and per-shipment structures. For stone distributors, the choice of model often depends on the distance from the port. Short-haul drayage might favor flat per-shipment rates, whereas regional deliveries benefit from per-mile structures. Supply chain volatility in 2026 demands agile pricing mechanisms that account for both distance and equipment availability, especially when dealing with overweight permits for 26.5-ton containers.
Detailed visibility into these drayage components allows distributors to provide more accurate quotes to contractors and designers. By breaking down the drayage cost per crate or per square foot, you avoid the trap of over-simplifying logistics as a fixed overhead, which is the primary reason many stone wholesalers see their year-end profits vanish.
Hidden Bank Fees: How Wire Transfers and FX Affect Margins
Currency exchange markups and opaque intermediary fees act as a silent tax on stone imports, often eroding 2% to 5% of your net margin before the first crate even leaves the quarry.
Many stone importers meticulously negotiate FOB prices and freight rates only to lose their hard-won savings at the point of payment. Banks and traditional financial institutions rarely disclose the true cost of moving money across borders. Instead, they embed profit into the “spread”—the difference between the mid-market exchange rate and the rate quoted to the business.
Foreign Exchange Markups and Mid-Market Spreads
Standard banking institutions typically apply FX markups ranging from 2% to 5% above the mid-market rate. Because this cost is baked directly into the conversion, it remains invisible on most bank statements. For a mid-sized distributor importing ten containers of Alaska Gray Quartzite, a 3% hidden markup on a $200,000 annual procurement spend results in $6,000 of lost capital that never reaches the supplier or the bottom line.
- Financial data from 2026 shows that 90% of B2B companies unknowingly overpay on currency spreads due to lack of rate transparency.
- Banks often quote a “preferred rate” that still sits significantly higher than the actual market value.
- Large-scale stone projects with tight bidding requirements cannot afford these unallocated costs in their landed cost formula.
Intermediary Banking and Correspondent Fees
Cross-border payments rarely travel directly from the buyer’s bank to the factory’s account. They pass through a network of intermediary or correspondent banks. Each institution in this chain may deduct a service fee—ranging from $15 to $50—without prior notice. When the funds finally arrive at the factory, the total is often short by $100 or more.
These discrepancies cause significant operational friction. At Pierre de source supérieure, we emphasize that payment terms are typically 30% deposit and 70% balance. If a balance payment arrives short due to intermediary deductions, it can trigger accounting holds that delay the release of Bill of Lading (BOL) documents. These delays lead to port storage fees that far exceed the original missing bank fee.
Cumulative Erosion of Net Profit Margins
The financial impact of these fees compounds over time. While a $50 wire fee seems negligible on a single sample order, the aggregate effect of FX markups and inbound processing fees on bulk orders can wipe out the cost advantages of sourcing directly from a quarry. In a market where fuel surcharges and drayage costs are already volatile, protecting the payment margin is one of the few variables an importer can actually control.
- A 3% hidden fee on a large-scale commercial project effectively negates the discount achieved through volume purchasing.
- Modern payment platforms offering mid-market rates provide a more predictable landed cost than traditional wire transfers.
- Active management of payment leakage is now a standard requirement for competitive stone wholesalers and retailers in 2026.

Creating a Landed Cost Calculator in Excel for Your Business
An automated Excel calculator transforms opaque factory quotes into actionable unit costs by accounting for heavy-weight logistics and volatile duty rates in real-time.
Defining Data Columns for Product Specifications
Setting up a clean data structure ensures that every variable, from stone weight to purchase price, remains organized for accurate calculation. Start by creating dedicated columns for SKU, stone series—such as our Flat, Rough, or Pencil series—and quantity. This granularity prevents inventory confusion when dealing with multi-product containers where different textures might occupy the same pallet space.
Input the specific weight per square foot for each product line. For example, Top Source Stone Flat Series typically ranges from 8-10 lbs per square foot, while the Rough Series can reach 10-13 lbs. Adding a “Factory Unit Price” column serves as your baseline. This figure represents the raw FOB cost before any logistics or tax additions enter the equation.
Selecting Weight-Based Allocation Methods
Natural stone panels are heavy, so weight-based allocation provides a more precise cost distribution than value-based methods. Value-based allocation often undercharges heavy, low-cost items and overcharges light, expensive ones. In the stone industry, shipping costs are driven by weight limits—often 17.5 to 21 tons for USA ports—not just container volume.
| Cost Driver | Allocation Method | Key Variable |
|---|---|---|
| Sea Freight | Proportional Weight | Total Shipment lbs / SKU lbs |
| Import Duties | Ad Valorem (%) | HTS Code (e.g., 6803.00.90) |
| Customs Bond | Fixed per Entry | Annualized Liability Estimate |
Use the total weight of the shipment to divide sea freight costs proportionally across different stone types. Apply the formula: (Individual SKU Weight / Total Shipment Weight) * Total Freight Cost. This approach ensures that a heavy quartzite panel absorbs a larger share of the shipping bill than a lighter slate panel, reflecting its true impact on the container’s capacity.
Calculating Duties and Customs Impact
Integrating tax variables directly into the spreadsheet prevents unexpected hits to the bottom line during the import process. Assign specific HTS (Harmonized Tariff Schedule) codes for natural stone products to automate duty percentage calculations. For example, use 6803.00.90 for slate or 6802.93.11 for quartzite. These codes dictate the tariff rate and vary significantly depending on the country of origin.
- Build a formula that multiplies the factory unit price by the current duty rate.
- Add fixed entry fees and customs bond costs, which typically range from $250 to $750 annually for continuous bonds.
- Track additional costs related to the three-stage quality control process to ensure the final landed cost reflects the total manufacturing investment.
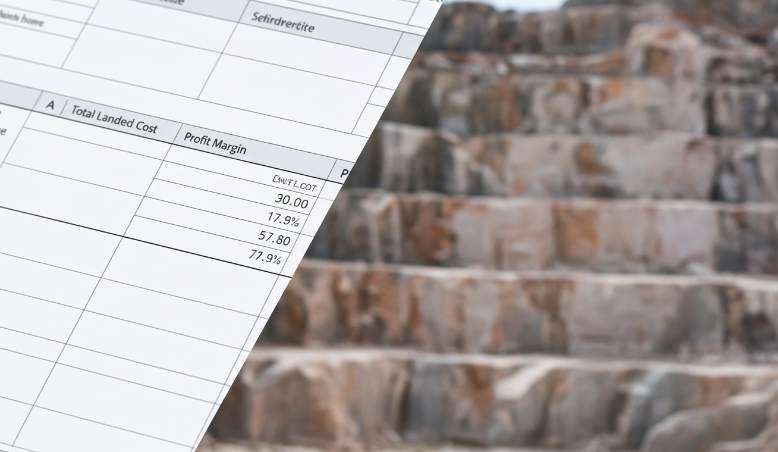
Projecting Final Margins and Wholesale Pricing
The final stage of the calculator compares the total landed cost against the target market price to secure project profitability. Sum all calculated components—unit price, freight, duties, bank FX fees (usually 2-5% markups), and local drayage—into a single “Total Landed Cost” cell for each SKU. This number represents the real price of the stone sitting in your warehouse.
Establish a “Target Margin” percentage to automatically generate suggested wholesale or contractor pricing. Compare these factory-direct landed costs against local competitors. Since Top Source Stone provides direct quarry sourcing, your calculator will likely show a significant margin advantage over distributors who buy through multiple middlemen. This data allows you to price aggressively while protecting your internal profit targets.
Conclusion
Calculating the true landed cost moves your procurement strategy beyond simple unit pricing to protect your actual profit margins. Factoring in sea freight, duties, and local drayage ensures you avoid the hidden expenses that often erode B2B earnings. This data-driven approach allows you to set competitive retail prices while maintaining a healthy bottom line for your stone business.
You can start by applying these formulas to your next shipment or reviewing your current freight contracts for hidden surcharges. If you need specific weight-optimized loading plans or duty-ready pricing for our Big 10 inventory, contact us for a detailed quote.
Foire aux questions
How to calculate landed cost for stone?
To calculate the total landed cost for stone, use the formula: Unit Price + Ocean/Air Freight + Customs Duties + Insurance + Port Handling Fees + Inland Trucking + Warehouse Overhead. Because stone is a heavy commodity, you must also factor in the cost of specialized crating and potential “overweight” surcharges applied by carriers to ensure your final per-unit price is accurate.
What is included in landed cost vs FOB?
FOB (Free On Board) only includes the cost of the stone and the expense of getting it onto the vessel at the port of origin. In contrast, Landed Cost is the comprehensive “door-to-door” total, incorporating everything in the FOB price plus international freight, cargo insurance, import duties, brokerage fees, and local delivery to your final job site or warehouse.
Average import duty for stone panels?
Average import duties for stone panels typically range between 0% and 6.5%, depending on the specific material (e.g., marble, granite, or slate) and the country of origin. However, it is critical to check for “Anti-Dumping” or “Countervailing Duties” (AD/CVD), which can exceed 300% for certain products from specific regions, significantly impacting the final procurement strategy.
Why is my shipping cost higher than the stone value?
Stone is a high-density, high-weight, but relatively low-unit-value commodity. Since freight costs are largely determined by weight and volume, the expense of moving heavy crates across the ocean and via local heavy-haul trucking often outpaces the raw material cost. This is common in the industry, particularly when shipping smaller quantities that do not benefit from full-container-load economies of scale.
How to track landed cost per square foot?
To track this accurately, divide the Total Landed Cost (sum of all acquisition and logistics expenses) by the total usable square footage received. For the most precise financial planning, apply a “yield factor” to this calculation to account for 5-10% potential breakage or waste during transit, ensuring your true cost per installed square foot is reflected in your margins.
